Differential Urban Hydrological Intelligence

Why did your street flood when the next ward didn't?

Conventional flood maps only show water depth. FloodLens diagnoses the physical failure mechanism—pairing inundated catchments with resilient twin wards across elevation gradients, stormwater drain conduits, and imperviousness.
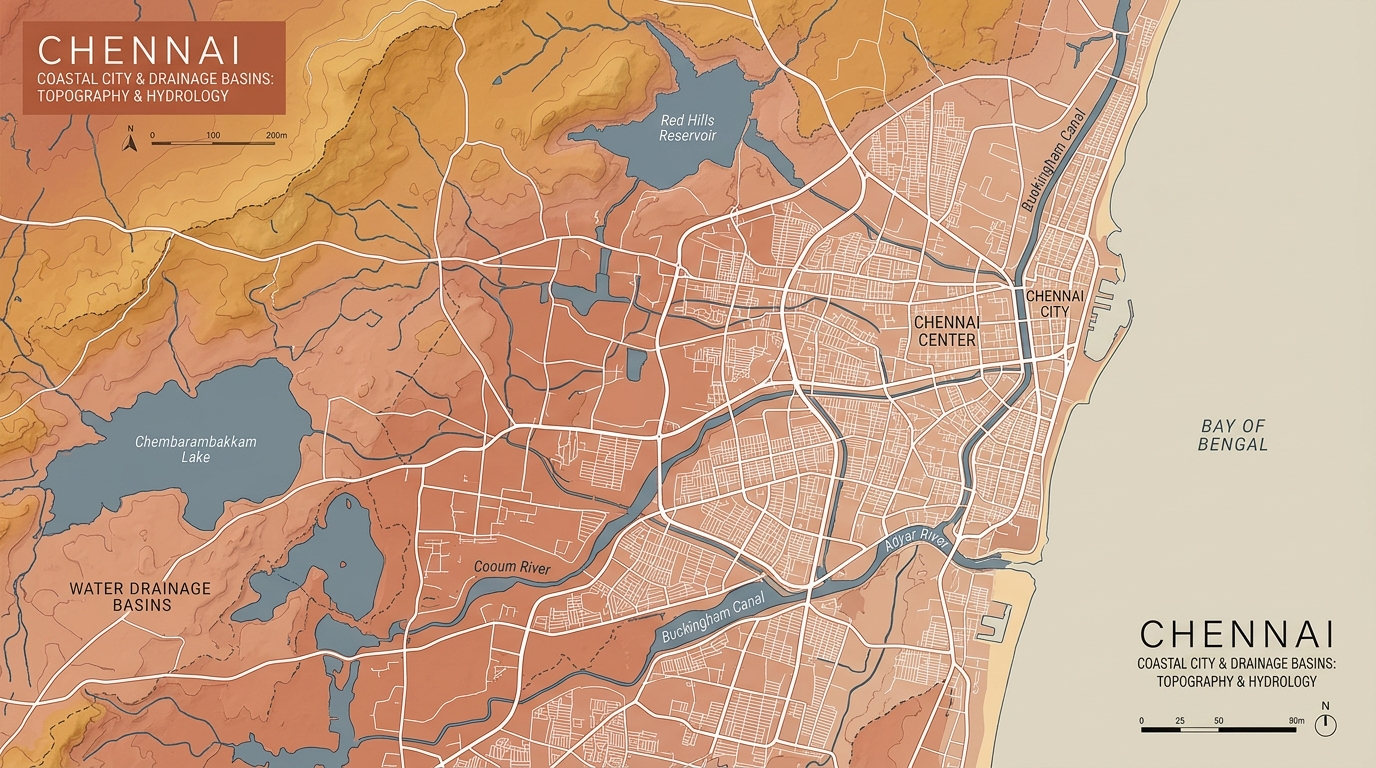
Chennai Coastal City & Drainage Basins Topography
Topographic Survey & Drainage Basin DatumGreater Chennai Corporation Hydrological Grid
Major River Systems: Cooum, Adyar & Buckingham Canal
Reservoirs: Red Hills & Chembarambakkam Lake
Explore Ward Hotspots on Map →
Basin Models
4 Wards
Calibrated GCC Catchments
Ground Truth
100+
Verified Inundation Markers
Physical Inputs
6 Vectors
DEM, HAND, SWD, Impervious
Inference Speed
<200ms
Causal Formulation Engine
Physical Subsurface Infrastructure Anatomy

Flooding Block vs Resilient Twin Block

See the exact underground mechanism: An identical cloudburst floods Block A due to conduit silt buildup and catch basin backwater, while Block B discharges smoothly via functional outfall slope. Click any pin or marking to inspect citizen-friendly details.
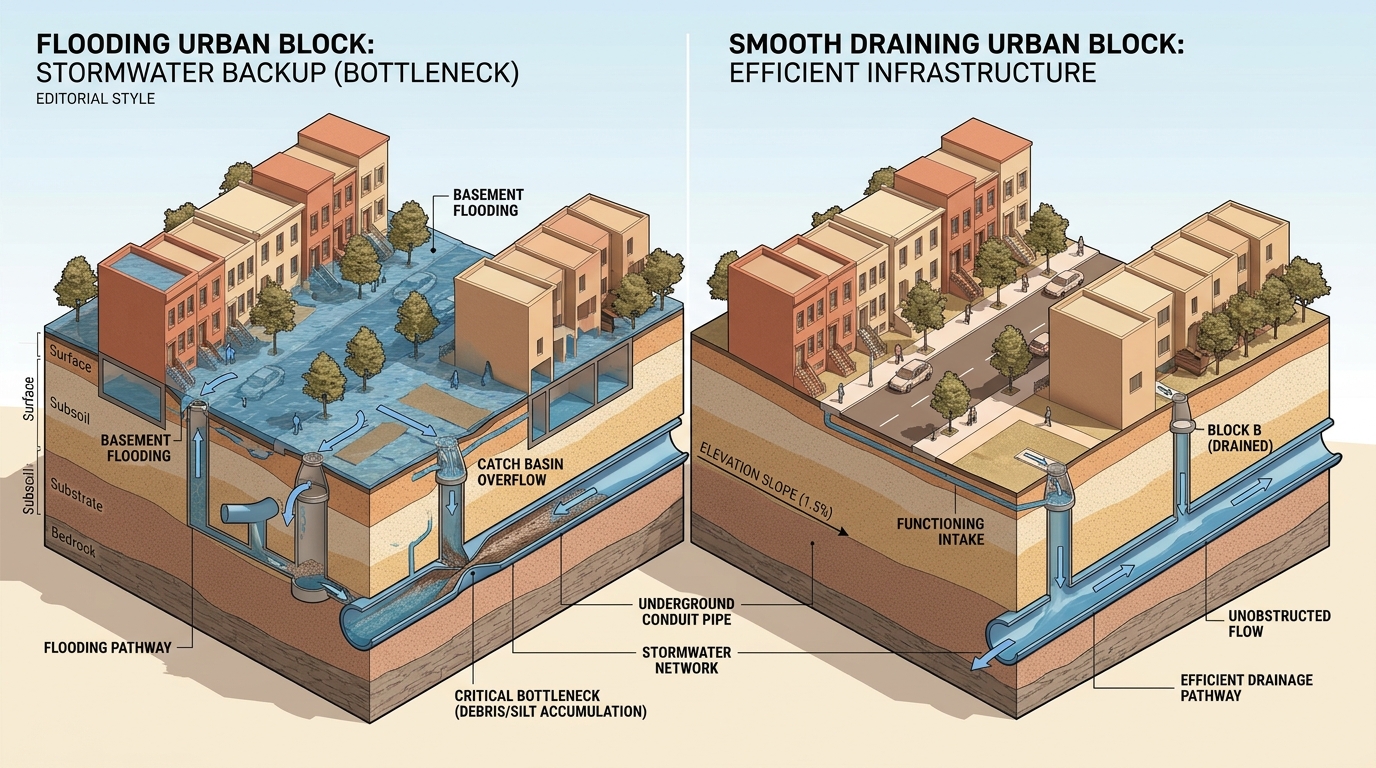
Flooding Urban Block vs Smooth Draining Urban Block Cross-Section
🔍 Click Any Marking Below to Reveal Citizen-Friendly Details & Examples:(Clicking blurs background & opens plain-English explanation)
Block A Failure Markings (Click to inspect):
Block B Resilience Markings (Click to inspect):
Primary Failure Bottleneck

Block A: Conduit Silt & Backwater Surcharge

Inundated

Hardened silt sedimentation and plastic debris inside underground conduits choke open cross-sectional volume by 58%. Under intense cloudbursts, stormwater cannot enter the trunk canal—instead, pressurized backwater surges vertically out of catch basin grates into streets and residential basements.

Silt Occlusion58% DepthCross-section loss
Reverse Head+1.40 mAbove street grate
Peak Capacity3.8 m³/sDeficit: -5.4 m³/s
Hydraulic Grade: Surcharged Reverse PressureFailure: High
Hydrological Control Benchmark

Block B: Unobstructed Gravity Fall Velocity

Resilient

Well-maintained conduit trunks with an unobstructed +1.5% positive bed gradient allow stormwater to accelerate into self-cleansing gravitational flow (>1.5 m/s). Runoff enters roadside grates immediately and discharges directly into receiving tidal canals without surface accumulation.

Invert Clearance100% FreeZero sediment bed
Bed Gradient+1.50 %v > 1.5 m/s self-clean
Discharge Rate11.2 m³/sSurplus: +2.0 m³/s
Hydraulic Grade: Free Gravity OutfallStatus: Optimal
Hydrological Reference & Civil Engineering Standards

Want to decode the technical conventions & physics formulas?

Explore the full interactive field reference: Rational Method, Manning's formula, Gradually Varied Flow backwater, and visual box architecture with details on demand.

Real Hydrological Physics & Directed Acyclic Graph (DAG)

Chennai Catchment Causal Flowchart

Trace the mathematical and physical sequence from extreme cloudburst rainfall (such as Cyclone Michaung) through conduit hydraulics, silt sedimentation, canal tidal surcharge, and street inundation.

Select Calibrated Ward Scenario:
Real-Time Hydraulic Parameter ControlsDrag sliders to simulate alternate storm severities or interventions
🌧️ 24h Rainfall390 mm
150mm (Moderate)480mm (Catastrophic)
🪨 Conduit Silt55% Blocked
0% (Clean)85% (Choked)
📐 Pipe Invert Slope-0.3%
-0.5% (Depression)+2.0% (Gravity)
🌊 Canal Tide Stage+1.3m MSL
+0.2m (Low)+2.2m (Surge)
🏙️ Impervious Cover84%
40% (Permeable)95% (Dense Urban)
Overland Runoff Intake3.14 m³/sRainfall intake rate
Conduit Drain Capacity2.76 m³/sManning gravity discharge
Backwater Surcharge Head+1.03m HeadReverse outward pressure
Predicted Street Ponding0.7m Depth · ~15h⚠️ Partial Ponding
Causal Hydraulic Topology (Click any box to inspect physical evidence)

Animated flowing streams indicate direction of fluid momentum. Vibrant popping pulses highlight bottleneck choke points.

Resilient Flow Throttled Surcharge / Inundated
PrecipitationTidal SurgeRunoff CInflow QTidal HeadConduit ChokeOverflowReverse Push01 · Cloudburst Rainfall390 mm / 24hRainfall02 · Built-up Impervious Cover84% Built-upCoeff 0.8103 · Stormwater Intake3.14 m³/sOverland Flow04 · Conduit Drain Capacity2.76 m³/sSilt 55%05 · Canal Outfall Stage+1.3m MSLCanal Stage06 · Backwater Inversion Wave+1.03m HeadReverse Head07 · Urban Inundation Stagnation0.7m Ponding~15h hold
Hydrological Inspector · Node Detail (Click any box above to switch)

06 · Backwater Inversion Wave

+1.03m Headcritical
Physical Mechanism & Causal Process
Gradually Varied Flow backwater curve pushing submerged canal head backward up through street manholes.
Calibrated against hydrodynamic conservation laws
Empirical Sensor Datum (Cyclone Michaung & Recent Floods)
Manhole telemetry logged positive outward geysering pressure rather than downward suction.
Ground-truth calibrated against GCC stormwater archives
Recommended Engineering Intervention
Construct inland inline surge relief chambers with one-way backflow prevention valves.
Test Countermeasure in Ward Diagnosis →
Interactive Twin Catchment Simulator

Differential Diagnosis in Action

Toggle calibrated urban twin scenarios to see how differential spatial analysis eliminates rainfall confounds to diagnose exact structural bottlenecks.

Comparative Twin Catchment Axis
Anna Nagar
(Ward 101)
vs
Velachery
(Ward 102)
Twin Fitness
83.2%
Causal Diagnosis Finding

Despite experiencing virtually identical cloudburst rainfall (390mm vs 382mm), Anna Nagar inundated due to downstream stormwater drain backwater stagnation and a local elevation depression.

🌧️ Rainfall Differential
+2.1% (Near-Identical Cloudburst)
Storm forcing neutralized
🚰 SWD Drain Conduit Capacity
-38% Effective Outfall Gradient
Primary structural constraint
⛰️ DEM Elevation Gradient
-1.4m Micro-depression Basin
Micro-depression ponding
🏙️ Urban Impervious Cover
+14% Built-up Impervious Surface
Loss of natural infiltration
Synthesized Mechanism RankingDEFENSIBLE
Rank #1 Primary Driver88% Confidence
Downstream SWD Backwater & Outfall Congestion
Rank #2 Surface Infiltration Exhaustion62% Confidence
Rank #3 Secondary Canal Tidal Hold31% Confidence
Sign In & Run Ward Diagnosis for This Pair
Methodology & Hydrological FAQ

Frequently Asked Questions

Understand how differential spatial twin formulation isolates structural civil failure points.

Traditional models treat rainfall volume as the sole driver. By pairing a severely flooded catchment with a resilient control ward that experienced identical radar-verified cloudburst rainfall (±3%), meteorological variance is neutralized. Any remaining divergence in ponding depth is mathematically attributed to physical constraints: pipe invert gradient, cross-sectional choking, or outfall tidal locking.
Both areas received extreme rainfall (over 400mm during Cyclone Michaung). However, Anna Nagar suffered from downstream stormwater drain (SWD) backwater congestion along the Otteri Nullah canal, exacerbated by a -1.4m micro-depression sink. Velachery, despite low elevation, had unobstructed trunk channels accepting storm intake at higher gravitational velocity.
The system couples the Rational Runoff Method (Q = C·I·A) for surface generation, Manning's Equation (Q = (1/n)·A·R^(2/3)·S^(1/2)) for conduit hydraulic capacity, and the Gradually Varied Flow (GVF) backwater differential equation (dy/dx = (S0 - Sf)/(1 - Fr²)) to predict reverse surcharge pressure through manholes.
FloodLens integrates Copernicus DEM GLO-30 digital elevation contours, GCC 2023 GIS SWD conduit geometry, ESA WorldCover 10m normalized land cover, and ground-truth verified GCC flood survey records spanning 2023 Cyclone Michaung, 2021, and historical events.
Yes. In both the Causal Flowchart and Ward Diagnosis, engineers can adjust conduit desilting percentages, retrofitted pipe cross-sections, tide flap-gates, or bioswale infiltration fractions to observe projected decreases in ponding depth and duration.

Ready to diagnose Chennai's urban catchment vulnerabilities?

Access the diagnostic matrix, compare monitored wards, and generate causal evidence reports in seconds.